The notion that the gold price is based on the economics of “Supply & Demand” turns out to be incorrect as the cost of production is the leading factor. This is also true for most commodities and energy.
Unfortunately, economists and most analysts in the precious metals community will continue to believe that the economic principle of supply and demand determines price. If we look at the data provided in this article, the individual will see how closely related the cost of gold production isto the spot price.
That being said, the information in this article is only to show the “commodity pricing mechanism” of gold, not its true store of value. There’s a big difference which 99% in the Mainstream media do not understand… and probably a good percentage in the precious metals community as well.
Unfortunately, economists and most analysts in the precious metals community will continue to believe that the economic principle of supply and demand determines price. If we look at the data provided in this article, the individual will see how closely related the cost of gold production is
That being said, the information in this article is only to show the “commodity pricing mechanism” of gold, not its true store of value. There’s a big difference which 99% in the Mainstream media do not understand… and probably a good percentage in the precious metals community as well.
Top Two Gold Miners Cost Of Production vs. The Gold Price
I decided to take the data from the top two gold miners, Barrick and Newmont, for this exercise as they are the largest two gold producers in the world. Yes, I could have spent several days compiling data from the top 20 gold miners, but I don’t have the luxury of being paid by a financial institution for my analysis. Regardless, Barrick and Newmont provide a good representation of the cost of producing gold in the entire industry.
According to my “Adjusted Income Approach” in determining the full cost of production, I constructed the chart below. One thing that is not included in the adjusted income approach is dividend payouts. I included this in my total cost per ounce for Barrick and Newmont:

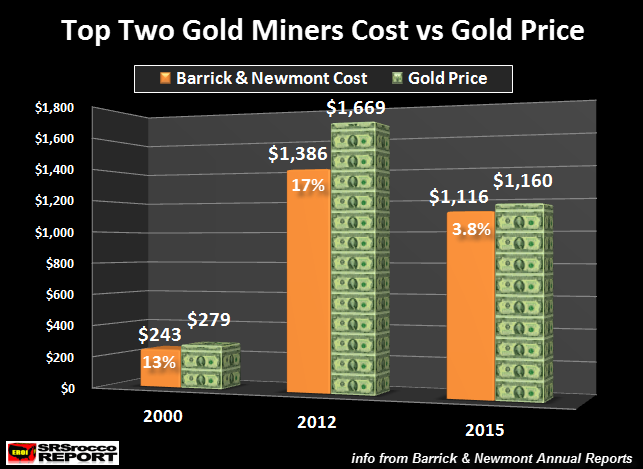
Here we can see that as the price of gold increased over the past 15 years, so did the cost of production for these top two gold miners. In 2000, the total average cost to produce gold for Barrick and Newmont was $243 versus the spot price of $279. Thus, the average profit margin was 13%for these gold mining companies that year.
As the average price of gold surged to a record $1,669 in 2012, the average cost to produce the yellow metal for Barrick and Newmont increased to $1,386. Yes, it’s true that these two gold miners enjoyed a 17% profit margin that year, but what is wrong with that?? Companies must haveprofits so they can pay for new projects, shareholder dividends or surplus cash for lean years when losses are incurred.
If we compare the increase in the gold price from 2000 to 2012 versus the cost of production, we will see a very interesting similar trend:
Gold Price Increasevs Cost Of Production 2000-2012
Gold Price Increase 2000 – 2012 = 498%
Gold Cost Increase 2000 – 2012 = 470%
While the average gold spot price increased 498% from 2000-2012, the cost of production for Barrick and Newmont jumped 470%. To put it another way, the difference between the increased cost of production (470%) and the average spot price (498%) in the 2000-2012 time period, was a lousy 6%.
I decided to take the data from the top two gold miners, Barrick and Newmont, for this exercise as they are the largest two gold producers in the world. Yes, I could have spent several days compiling data from the top 20 gold miners, but I don’t have the luxury of being paid by a financial institution for my analysis. Regardless, Barrick and Newmont provide a good representation of the cost of producing gold in the entire industry.
According to my “Adjusted Income Approach” in determining the full cost of production, I constructed the chart below. One thing that is not included in the adjusted income approach is dividend payouts. I included this in my total cost per ounce for Barrick and Newmont:

Here we can see that as the price of gold increased over the past 15 years, so did the cost of production for these top two gold miners. In 2000, the total average cost to produce gold for Barrick and Newmont was $243 versus the spot price of $279. Thus, the average profit margin was 13%
As the average price of gold surged to a record $1,669 in 2012, the average cost to produce the yellow metal for Barrick and Newmont increased to $1,386. Yes, it’s true that these two gold miners enjoyed a 17% profit margin that year, but what is wrong with that?? Companies must have
If we compare the increase in the gold price from 2000 to 2012 versus the cost of production, we will see a very interesting similar trend:
Gold Price Increase
Gold Price Increase 2000 – 2012 = 498%
Gold Cost Increase 2000 – 2012 = 470%
While the average gold spot price increased 498% from 2000-2012, the cost of production for Barrick and Newmont jumped 470%. To put it another way, the difference between the increased cost of production (470%) and the average spot price (498%) in the 2000-2012 time period, was a lousy 6%.
- Source, SRSRocco, Read More Here