buy gold and silver bullion

Tuesday 31 January 2017

If Trump Orders Gold Audit: Gold Explodes


Which way will President Trump take the US economy and what will the Trump effect be on gold? Proprietary analyst and founder of Kirby Analytics, Rob Kirby, predicts the most likely and most dramatic actions we should watch for from Trump, and how to position your family to weather the road ahead!


Thursday 26 January 2017

Gold Needs To Be In Pension Funds Before They Implode

Tens of millions of Americans and their employers pour money into pension plans each month, counting on those funds to grow and to be there when needed at retirement.

But a time bomb awaits. The bulk of U.S. pension funds are dangerously underfunded, and the assets are often invested in securities that have bleak prospects for providing income that keeps up with a general decline in purchasing power.

A pension plan requires an employer to make contributions into a pool of funds set aside for a worker’s future benefit. In 1875, when the American Express Company established the first private pension plan in the United States, the face of retirement was fundamentally changed. Before that time, private-sector pension plans did not exist, as most employers were small “mom-and-pop” businesses.

The innovation at American Express caught on. By 1929, 397 private sector pension funds were in operation throughout the United States and Canada. As of 2011, according to the Bureau of Labor Statistics, 18% of private sector workers are covered by pension plans. At the end of 2015, the value of U.S. pension funds was $21.7 trillion.

Millions of Americans will rely on pensions once they’ve reached the age of retirement. Pension fund managers have a fiduciary duty to safeguard funds against foreseeable risk. With the practices of today’s Federal Reserve, there is no risk more foreseeable than inflation, but these fiduciaries are not fulfilling their duty to protect against this significant risk by investing in assets which are specifically suited to defend against the perpetual loss of the dollar’s purchasing power.


Chief among these assets are physical gold and silver, the most reliable inflation hedges from time immemorial.
Nothing Is Certain Except Death, Taxes, and Dollar Devaluation

In today’s uncertain times, few things are as certain as the devaluation of the dollar. Having lost more than 95% of its valuesince the creation of the Federal Reserve in 1913, America’s unbacked fiat currency has a 100-year track record of declining value year after year. There is no reason to expect this trend to reverse, and the possibility of a total collapse of the dollar at some point cannot be ruled out. This is important because of the dollar’s inverse relationship to the price of gold.

As the unbacked Federal Reserve Note continues to be abused and devalued, it becomes clearer every day that pension funds should increase their precious metals holdings.

According to the Asset Allocation Survey by the U.S. Council of Institutional Investors, only 1.8% of pension fund investments are in the broad commodities category, which includes monetary metals. That means only a fraction of 1% in pension assets are held in gold and silver.


Instead, pension funds today focus their investments in U.S. Treasury securities, investment-grade bonds, stocks, real estate, and other interest-rate sensitive assets.
Gold Counter-Balances Other Investments

Whether it is an individual investing $1,000 or a fund manager in charge of investing millions of dollars, risk management is crucial.

Fund managers typically will not invest in extremely risky investments for fear of losing their investment, and potentially, their jobs. Conventional wisdom is that government bonds are paramount in safety and security.

But these bonds, as well as the Federal Reserve Note “dollar” itself, are backed by nothing more than the full faith and credit of an insolvent U.S. government. Washington D.C. has accumulated astronomical debts of more than $20 trillion and total long-term entitlement obligations now top $100 trillion. Officials will only be able to “meet” these long-term commitments by inflating them away. That is why money creation at the Federal Reserve has become standard operating procedure. Gold, on the other hand, appreciates as the dollar’s value falls, not to mention offering resilience to financial and political crises.

The financial establishment remains hostile to gold, but influential people are making the case for larger gold holdings. Alistair Hewitt, head of market intelligence at the World Gold Council, said, “Unless investors are willing to accept a loss-making investment strategy, they may need to consider increasing their holdings of gold. We believe this should resonate especially well with pension funds and foreign managers whose investment guidelines are typically stricter and who hold a large portion of bonds in their portfolios.”

Getting fund managers to include physical gold in pensions is a difficult challenge. While they have a fiduciary responsibility to protect and grow their clients’ investment, most prefer to stick with the conventional wisdom and avoid bucking the system – but there are other pressures as well. Guy Christopher writes, “Precious metals in your possession have no counterparties and no continuing fees and commissions, unlike the thousands of investments brokers sell. Once you own gold, that part of your wealth and your future is out of Wall Street’s hands.”
Look to Texas for the Blueprint on Gold-Invested Pension Funds

The Texas Teacher Retirement Fund and the University of Texas own nearly $1 billion in physical gold, which will soon be transferred from Wall Street vaults to a brand-new depository in the Lone Star State thanks to the recently passed Texas Bullion Depository legislation.

Shayne McGuire, portfolio manager of the Gold Fund for the Teacher Retirement Fund of Texas said that “one of the main reasons we considered gold was the diversification benefits it provides to portfolios dominated by equities, as most pension funds are.”

While most pension fund managers shy away from gold, they do so at their own risk and the risk of their pensioners. As a non-correlated asset to bonds, stocks, and other paper-based investments, precious metals are key to true diversification. It’s time for pension fund managers to break out of their Wall Street groupthink and include a meaningful allocation to physical gold and silver bullion for protection against inflation and financial turmoil.


Monday 23 January 2017

GATA'S Bill Murphy On Gold & Silver And The Central Bankers


Join Rory Hall of The Daily Coin Bill Murphy of GATA in this insightful interview on the Central Banksters and how there starting to lose they're grip on Precious Metals and will be over powered through the Global Markets.


Monday 16 January 2017

Could Trump’s Border Tax Ignite CHAOS in the US Silver Market?


Doc & Dubin Are Back in the Saddle Breaking Down the Big PM Rally to Start 2017.

Doc Presents A Potential Black Swan For Silver Entirely Off the Radar:

Could Donald Trump's Border Tax Plan Unleash Absolute CHAOS in the US Silver Market?


Friday 13 January 2017

Manipulation Crushed Profit Margins At Largest Primary Silver Mining Producer

The profit margin trend at the world’s largest primary silver mining company has experienced a rapid decline over the past several years. Fresnillo PLC in Mexico, is the largest primary silver mining company in the world. Last year, Fresnillo PLC produced 47 million of silver and 762,000 oz of gold.

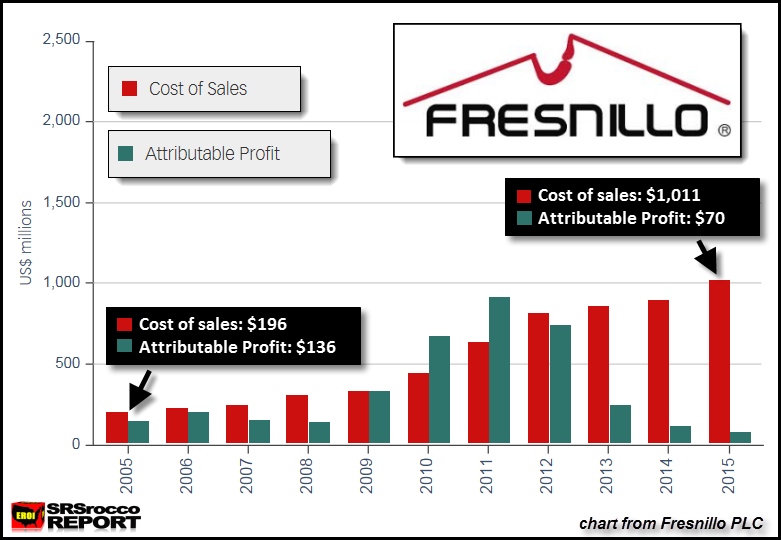
For all their hard work, Fresnillo’s profit margin versus its cost of sales fell to an all-time low of 7% in 2015. This can most certainly be blamed on market intervention, which I will discuss in more detail in upcoming articles.

The chart below shows how the company’s cost of sales has increased to $1.01 billion while their attributable profit fell to only $70 million:


Now compare the huge difference between the 2015 figures to 2005. In 2005, Fresnillo PLC’s cost of sales were only $196 million versus their attributable profit of $136 million. Thus, the company’s attributable profit margin to their cost of sales was 70%… ten times higher than it was in 2015.

Furthermore, Fresnillo PLC produced a lot more silver and gold in 2015 versus 2005.

Fresnillo PLC Silver & Gold Production (Moz = million oz.)

2005 Silver production = 35.2 Moz

2005 Gold production = 277,000 oz

2015 Silver production = 47 Moz

2015 Gold production = 762,000 oz

Even though Fresnillo PLC increased their silver production significantly over the past decade, it is their gold production that experienced the most rapid growth. However, the company enjoyed a much higher profit margin on its cost of sales in 2005 when it was producing a lot less gold and silver.

If we look at the chart above, we can clearly see that the attributable profits for years 2013-2015 were about the same as what Fresnillo PLC made from 2005-2008, but, the cost of sales were three to four times less during the early period than they were from 2013-2015.

As we can see, something clearly changed on Fresnillo PLC’s income statement after 2012. Again, this was due to market invention by the Federal Reserve and Central Banks via the bullion banks paper trading markets.

That being said, I need to clarify a few things. While the chart above shows Fresnillo PLC’s cost of sales, this does not include all their total costs. The cost of sales figures only represent what takes place at the actual mine. If we add additional costs, such as administration, exploration, selling expenses and even income tax, the total (more realistic) cost is much higher.

For example, Fresnillo PLC’s additional costs were in 2015:
Administration cost = $63 million
Exploration cost = $140 million
Selling expenses = $14 million
Income tax expense = $143 million

Thus, Fresnillo PLC’s attributable profit of $70 million was even less at only 5% when we compare it to their total revenue of $1.44 billion.
Fresnillo PLC Capital Expenditures Have Jumped Nearly Eight Times While Profits Evaporated


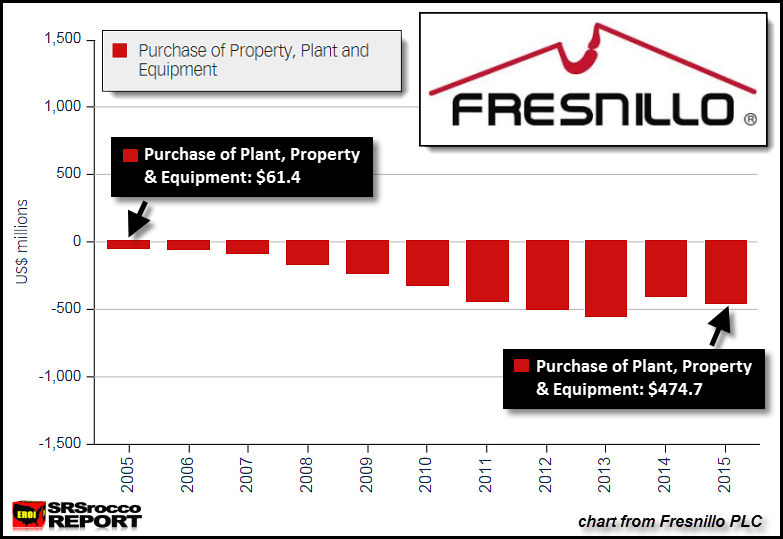
Fresnillo PLC’s capital expenditures were $475 million in 2015 versus $61 million in 2005. The increased capital costs were due to expansion of new projects as well as increased higher sustaining capital costs. It would have been nice for Fresnillo PLC to make better profits on the large amount of capital and money they spend to provide gold and silver to the market.

I stated in the beginning of the article that “Market Invention” was the cause of Fresnillo’s deteriorating profit margins. While many things can be blamed on “market intervention” or “manipulation”, new evidence released from Wikileaks cable published on GATA’s website, states that it was done on purpose to keep the public from hoarding physical gold.

Again, I will be writing articles discussing this in detail. However, the primary gold and silver miners are few of the only companies producing REAL WEALTH in the world. It is a shame that “market intervention” is crippling the only industry that provides the world with real wealth.

Lastly, even though I have shown how Fresnillo PLC’s profit margin has really fallen in the past several years, I believe this is one of the strongest primary silver and gold mining companies in the world. Most other gold and silver mining companies lost money in the past two-three years, but Fresnillo PLC still made some profits.

Furthermore, the best performing mining companies in the future when the GREATEST FINANCIAL PONZI SCHEME in history starts to unravel will be those who produce mostly gold and silver. What I mean by that is a company’s revenue that predominately comes from both gold and silver mining.

For example, Fresnillo PLC’s silver and gold metal sales in 2015 accounted for 91% of their total revenues. Compare that to Pan American Silver’s 73% of total revenues came from silver and gold metal sales for the same year.

Regardless, the market has no clue just how undervalued physical precious metals are as well as the primary gold and silver miners. When the FIAT MONETARY FAN finally hits the COW EXCREMENT, the market price of these extremely rare assets will surge higher.

- Source, SRS Rocco

Sunday 8 January 2017

Accounting Gimmicks Won’t Stop The U.S.A. Titanic From Sinking

The U.S. Government has gone to great lengths in using accounting gimmicks to prop up the financial system and domestic economy. One area where this is readily apparent is the disconnect between the rising U.S. debt versus the annual budget deficits.

Mish Shedlock wrote about this in his article, U.S. Deficit at $590 Billion But Debt Up $1.2 Trillion: Sleight Of Hand Magic:

The US deficit is up $590 billion so one might think total US debt would rise by that amount or at least something close to that amount.

Instead, total US debt for the fiscal year that just closed soared by over $1.2 trillion. What’s going on?

The shortest answer is “deficit lies”. The longer answer involves numerous off budget items like social security do not count towards the deficit but do count towards debt.

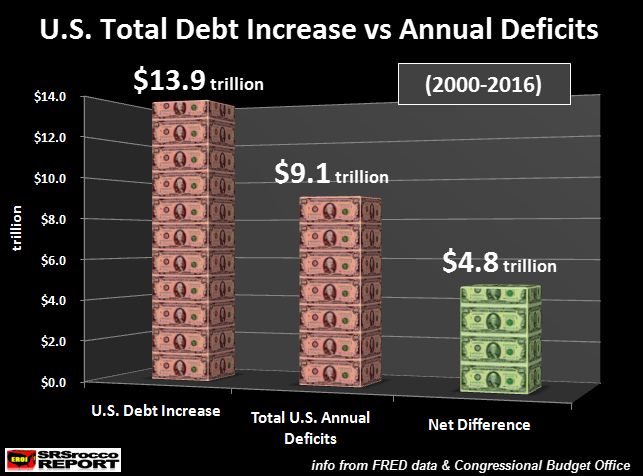
I calculated the increase of total U.S. debt from 2000 to 2016 as well as the annual budget deficits:


From 2000-2016, the total U.S. debt increased by $13.9 trillion while the annual budget deficits equaled $9.1 trillion. Thus, we had a net difference (or shortfall) of $4.8 trillion. Basically, the total U.S. debt increased $4.8 trillion more than the annual budget deficits during that time period.

So, how could this be? From the article linked above Hoisington Management stated the following about the increase in debt versus the deficits:

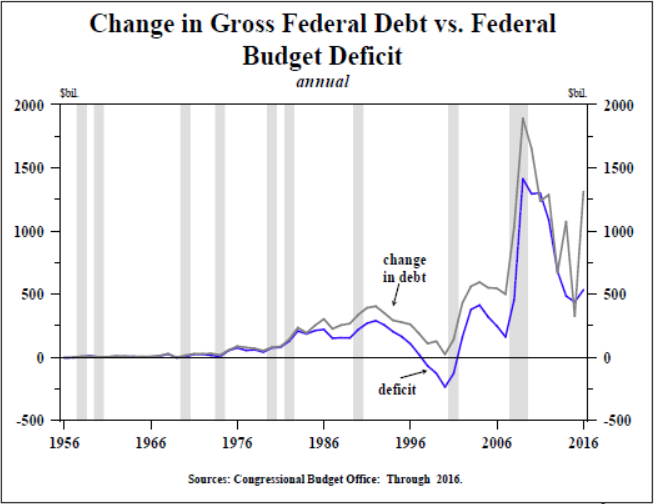
“From 1956 until the mid-1980s, the change in gross federal debt was always very close to the deficit (Chart 1). However, over the past thirty years the change in debt has exceeded the deficit in 27 of those years, which served to conceal the degree to which the federal fiscal situation has actually deteriorated. The extremely large deviation between the deficit and debt in 2016 illustrates the complex nature of the government accounting.


The increase in debt for that period was over $1.2 trillion while the deficit was $524 billion, a near $700 billion difference. The discrepancy between these two can be broken down as follows (Table 1): (a) $109 billion (line 2) was due to the change in the treasury cash balance, a common and well understood variable item; (b) $270 billion (line 3) reflects various accounting gimmicks used in fiscal 2015 to limit the size of debt in order to postpone hitting the Debt Limit. Thus, debt was artificially suppressed relative to the deficit in 2015, and the $270 billion in line 3 is merely a reversal of those transactions, a one-off, non-recurring event; (c) $93 billion (line 4) was borrowed by the treasury to make student loans, and this is where it gets interesting. Student loans are considered an investment and therefore are not included in the deficit calculation.

Nevertheless, money has to be borrowed to fund the loans, and total debt rises; (d) In the same vein, $70 billion (line 5) was money borrowed by the treasury to increase spending on highways and mass transit. It is not included in the deficit calculation even though the debt increases; (e) $75 billion (line 6) was borrowed because payments to Social Security, Medicare and Affordable Care Act recipients along with the government’s civilian and military retirees were greater during this time frame than the FICA and other tax collections, a demographic development destined to get worse; (f) Finally, the residual $82 billion (line 9) is made up of various unidentifiable expenditures including “funny money securities stuffed in various trust funds”.

What is interesting to take notice in the chart in the quoted text above, is that the high spike in total U.S. debt versus the annual budget deficit took place during the 2008-2009 U.S. financial and economic crash. However, another large spike took place in 2016 as the total debt increased $1.2 trillion versus $590 billion in the budget deficit.

So, why such a big increase in 2016 if the U.S. economy and stock market is supposedly very strong??? Or is the financial situation much worse than we are led to believe?

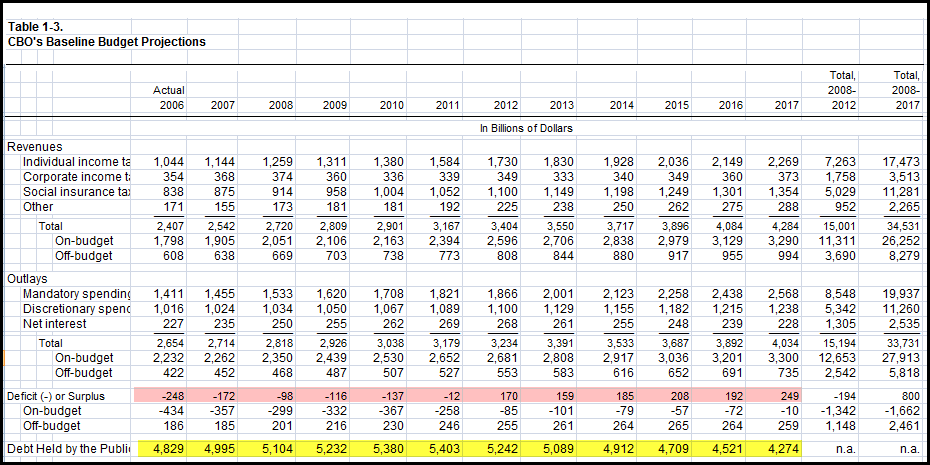
Well, to get an idea of where we are going, we need to look at how the U.S. Government forecasted its budgets in the past. Here is the CBO – Congressional Budget Office ten-year budget from 2008 to 2017. The excel table below also includes years 2006 and 2007:


It’s kind of hard to read all the data, but the highlighted RED AREA is the annual deficits or surpluses, and the YELLOW is the debt held by the public. Now, this public debt amount is not the entire U.S. debt, just the public debt. The figures highlighted in YELLOW do not include the “Intragovernmental Holdings.”

For example, in 2006, the total public debt (yellow) was $4.829 trillion. However, the total U.S. Government debt was $8.5 trillion that year. Thus, the Intragovernmental holdings were approximately $3.7 trillion.

So, according to the CBO ten-year budget in for 2008-2017, there would be a net surplus of $800 billion (this is all the way to the right of the highlighted yellow line) and the total public debt (minus intergovernmental holdings) would fall to $4.274 trillion in 2017.

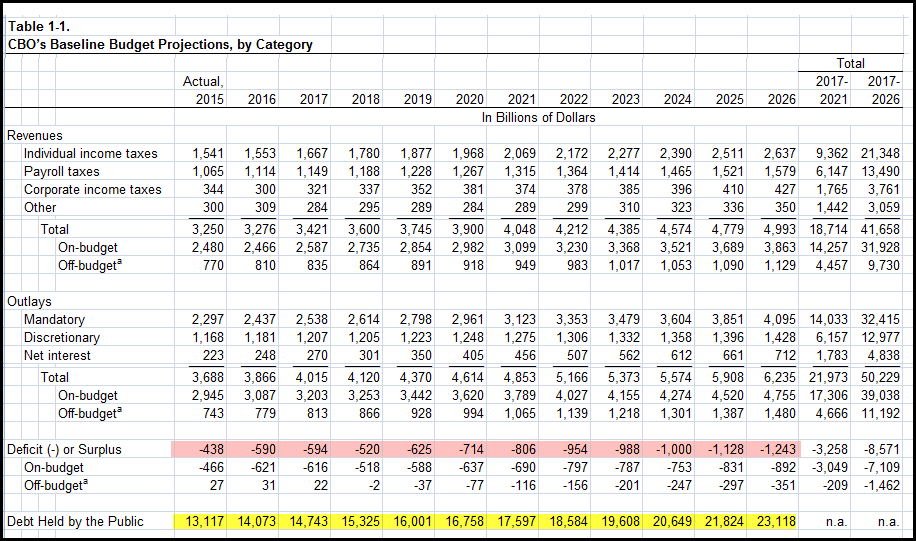
So, what really happened? Here is the CBO’s ten-year budget for 2017-2026:


If we look at 2017, the total U.S. public debt is forecasted to reach $14.743 trillion. Thus, the CBO blew their previous 2008-2017 budget by a cool $10 trillion. Again, the CBO forecasted that the total public debt would only be $4.274 trillion in 2017, nowhere near the $14.473 trillion they forecast for next year.

Furthermore, the CBO forecasts the cumulative deficits will be an additional $8.571 trillion from 2017-2026 (this is all the way to the right of the yellow highlighted line).

Let’s put the CBO ten-year budget forecasts into perspective. According to their 2008-2017 budget made in 2007, they forecasted the total pubic debt would fall from $4.995 trillion in 2008 to $4.274 trillion in 2017. It didn’t. Instead it is forecasted to jump by $10 trillion to $14.743 trillion in 2017. Again, the CBO understated the rising public debt by $10 trillion.

Moreover, the CBO forecasted that the U.S. government would enjoy a $800 billion net surplus from 2008-2017. Instead, the net annual deficits from 2006 to 2016 accounted to over $8 trillion. So, they blew that by almost $9 trillion. We get that $9 trillion figure by adding the $800 billion surplus to the $8 trillion deficit.

If the CBO got their ten-year budget from 2008-2017 off by $10 trillion in public debt and $9 trillion in cumulative annual deficits, how much will their 2017-2026 budget forecast be off by???

Hell, the CBO forecasts $9 trillion more in public debt by 2026 and $8.5 trillion in cumulative annual deficits. So, in all likelihood, their forecast will be off by at least 50%, or more.

Again, total current U.S. debt is $19.9 trillion. This includes $14.4 trillion in public debt and $5.5 trillion in Intragovernmental Holdings. If the CBO is budgeting $23 trillion in just public debt, we can add another $6-7 trillion for Intragovernmental Holdings, for a total of $30 trillion by 2026. But, wait… they are probably going to be off by at least another $10-$15 trillion

What kind of interest on the debt would it be if U.S. total debt reached $40 trillion?

Actually, I doubt we are going to make it that long. If you have been reading my energy analysis, the WHEELS FALL OFF THE ECONOMY well before 2026. And in all likelihood, the sinking of the U.S.A TITANIC will probably take place during President-elect Trump’s administration.

Lastly…. there seems to be a many disillusioned precious metals investors who are throwing in the towel due to the supposed Trump Kool-Aid. This doesn’t surprise me one bit. It takes a special person to stick to their guns when the GOING GETS ROUGH.

While the U.S. debt will continue higher, along with the broader stock markets, trying to time the EXIT STRATEGY will be the worse mistake anyone can make.

- Source, SRS Rocco

Thursday 5 January 2017

China Threatens Trump With "Big Sticks" If He Wages A Trade War

In the latest not too subtle threat lobbed by China's official press aimed at Donald Trump, the mainland media warned the President-elect that he’ll be met with "big sticks" if he tries to ignite a trade war or further strain ties.

"There are flowers around the gate of China’s Ministry of Commerce, but there are also big sticks hidden inside the door -- they both await Americans," the Communist Party’s Global Times newspaper wrote in an editorial Thursday in response to Trump’s plans to nominate lawyer Robert Lighthizer, who has criticized Beijing’s trade practices, as U.S. trade representative.

The latest lashing out at Trump from a state-run outlet, noticed first by Bloomberg, followed others last month aimed at Peter Navarro, a University of California at Irvine economics professor and critic of China’s trade practices whom Trump last month named to head a newly formed White House National Trade Council. Those picks plus billionaire Wilbur Ross, the nominee for commerce secretary, will form an "iron curtain" of protectionism in Trump’s economic and trade team, the paper wrote.

The three share Trump’s strong anti-globalization beliefs and seem unlikely to keep building the current trade order, it said, adding that they will be more interested in disrupting the world trade order.

Concurrently, SCMP reported that China’s state media have lambasted US president-elect Donald Trump for commenting on and conducting foreign policy on Twitter. The state-run news agency Xinhua ran a signed commentary headlined “Addiction to Twitter diplomacy is unwise” late on Tuesday night.

The article came after Trump fired another salvo at China through Twitter on Tuesday, accusing Beijing of refusing to help contain North Korea’s nuclear ambitions.

Trump first questioned in a tweet North Korea’s claims that it was in the final stages of testing a ballistic missile capable of reaching American soil. He later tweeted: “China has been taking out massive amounts of money & wealth from the US in totally one-sided trade, but won’t help with North Korea. Nice!”

The Xinhua commentary said Trump’s use of Twitter had aroused widespread concern among US politicians and academics.

For now China appears to have fallen off Trump's radar, and instead over the past few days the president-elect has been focusing on the ongoing Russian hacking fiasco as well as slamming "head clown" Chuck Schumer for the mess that is Obamacare.


- Source, Zero Hedge

Monday 2 January 2017

Bitcoin Surges Above $1,000 As China Unveils New Capital Controls

As noted yesterday, for the first time in three years, and only the second time in history, bitcoin rose above $1,000 in Yuan-denominated Chinese trading, however it was limited to the lower side of this "round number" psychological barrier in US trading, as BTC flirted with $999.99 for most of the day on the popular Coinbase exchange, without crossing it.


Overnight, however, Chinese demand proved too great and US markets had no choice but to arb the difference. So with Bitcoin trading in China at an implied price of over $1,050 at this moment, bitcoin finally soared above $1,000 in the US as well, trading just around $1,024 on Coinbase as of this moment.


Various catalysts for the recent surge have been cited, chief among which is the ongoing crackdown against cash in India providing a new source of demand for bitcoin. However, the most immediate driver of the recent burst in Chinese demand originates, not unexpectedly, from China where Beijing over the weekend implemented even more of what we have said since September 2015 will keep pushing bitcoin relentlessly higher: capital controls.

Recall that as we noted over the weekend, in order to further curb capital outflows, Chinese banks will be required to report all yuan-denominated cash transactions exceeding 50,000 yuan (around 7,100 US dollars) to the People's Bank of China (PBOC), down from the current level of 200,000 yuan, according to a PBOC document released on Friday. Cross-border transfers more than 200,000 yuan by individuals will also be subject to the report process. In terms of foreign currencies, the report threshold remains at the equivalent of 10,000 US dollars for both cash transactions and overseas transfers.

- Source, Zero Hedge