Mish Shedlock wrote about this in his article, U.S. Deficit at $590 Billion But Debt Up $1.2 Trillion: Sleight Of Hand Magic:
The US deficit is up $590 billion so one might think total US debt would rise by that amount or at least something close to that amount.
Instead, total US debt for the fiscal year that just closed soared by over $1.2 trillion. What’s going on?
The shortest answer is “deficit lies”. The longer answer involves numerous off budget items like social security do not count towards the deficit but do count towards debt.
I calculated the increase of total U.S. debt from 2000 to 2016 as well as the annual budget deficits:
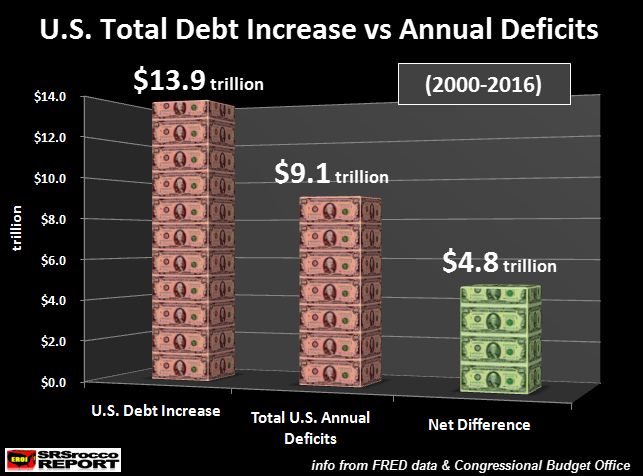
From 2000-2016, the total U.S. debt increased by $13.9 trillion while the annual budget deficits equaled $9.1 trillion. Thus, we had a net difference (or shortfall) of $4.8 trillion. Basically, the total U.S. debt increased $4.8 trillion more than the annual budget deficits during that time period.
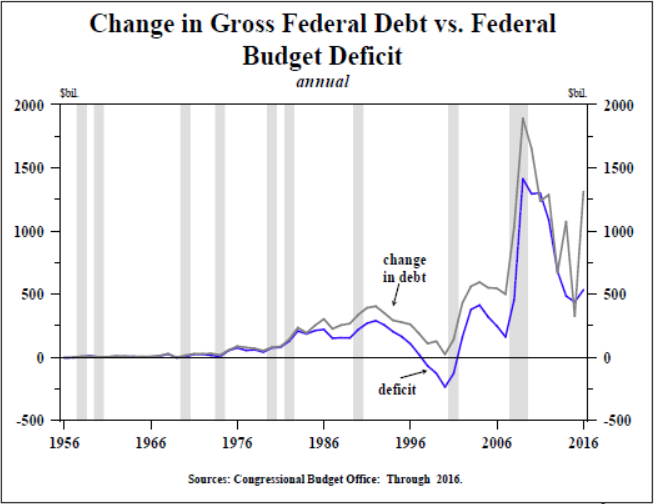
So, how could this be? From the article linked above Hoisington Management stated the following about the increase in debt versus the deficits:
“From 1956 until the mid-1980s, the change in gross federal debt was always very close to the deficit (Chart 1). However, over the past thirty years the change in debt has exceeded the deficit in 27 of those years, which served to conceal the degree to which the federal fiscal situation has actually deteriorated. The extremely large deviation between the deficit and debt in 2016 illustrates the complex nature of the government accounting.
The increase in debt for that period was over $1.2 trillion while the deficit was $524 billion, a near $700 billion difference. The discrepancy between these two can be broken down as follows (Table 1): (a) $109 billion (line 2) was due to the change in the treasury cash balance, a common and well understood variable item; (b) $270 billion (line 3) reflects various accounting gimmicks used in fiscal 2015 to limit the size of debt in order to postpone hitting the Debt Limit. Thus, debt was artificially suppressed relative to the deficit in 2015, and the $270 billion in line 3 is merely a reversal of those transactions, a one-off, non-recurring event; (c) $93 billion (line 4) was borrowed by the treasury to make student loans, and this is where it gets interesting. Student loans are considered an investment and therefore are not included in the deficit calculation.
Nevertheless, money has to be borrowed to fund the loans, and total debt rises; (d) In the same vein, $70 billion (line 5) was money borrowed by the treasury to increase spending on highways and mass transit. It is not included in the deficit calculation even though the debt increases; (e) $75 billion (line 6) was borrowed because payments to Social Security, Medicare and Affordable Care Act recipients along with the government’s civilian and military retirees were greater during this time frame than the FICA and other tax collections, a demographic development destined to get worse; (f) Finally, the residual $82 billion (line 9) is made up of various unidentifiable expenditures including “funny money securities stuffed in various trust funds”.
What is interesting to take notice in the chart in the quoted text above, is that the high spike in total U.S. debt versus the annual budget deficit took place during the 2008-2009 U.S. financial and economic crash. However, another large spike took place in 2016 as the total debt increased $1.2 trillion versus $590 billion in the budget deficit.
So, why such a big increase in 2016 if the U.S. economy and stock market is supposedly very strong??? Or is the financial situation much worse than we are led to believe?
Well, to get an idea of where we are going, we need to look at how the U.S. Government forecasted its budgets in the past. Here is the CBO – Congressional Budget Office ten-year budget from 2008 to 2017. The excel table below also includes years 2006 and 2007:
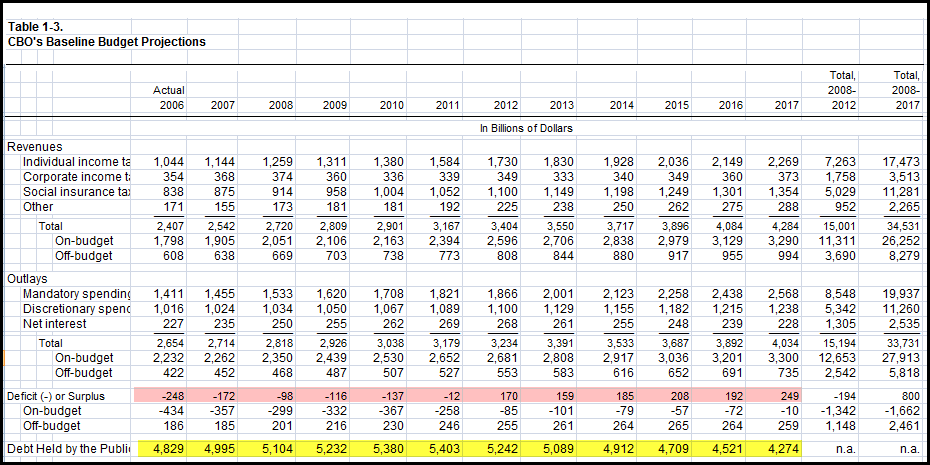
It’s kind of hard to read all the data, but the highlighted RED AREA is the annual deficits or surpluses, and the YELLOW is the debt held by the public. Now, this public debt amount is not the entire U.S. debt, just the public debt. The figures highlighted in YELLOW do not include the “Intragovernmental Holdings.”
For example, in 2006, the total public debt (yellow) was $4.829 trillion. However, the total U.S. Government debt was $8.5 trillion that year. Thus, the Intragovernmental holdings were approximately $3.7 trillion.
So, according to the CBO ten-year budget in for 2008-2017, there would be a net surplus of $800 billion (this is all the way to the right of the highlighted yellow line) and the total public debt (minus intergovernmental holdings) would fall to $4.274 trillion in 2017.
So, what really happened? Here is the CBO’s ten-year budget for 2017-2026:
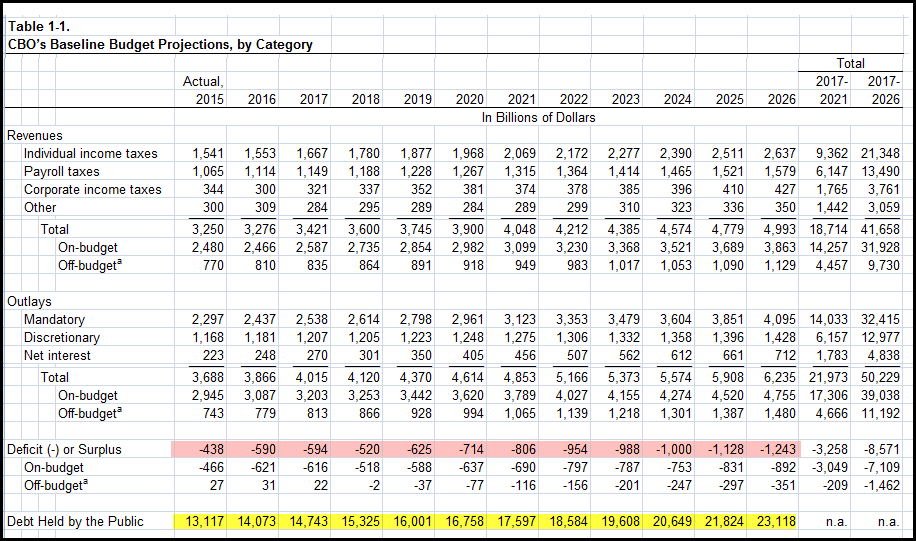
If we look at 2017, the total U.S. public debt is forecasted to reach $14.743 trillion. Thus, the CBO blew their previous 2008-2017 budget by a cool $10 trillion. Again, the CBO forecasted that the total public debt would only be $4.274 trillion in 2017, nowhere near the $14.473 trillion they forecast for next year.
Furthermore, the CBO forecasts the cumulative deficits will be an additional $8.571 trillion from 2017-2026 (this is all the way to the right of the yellow highlighted line).
Let’s put the CBO ten-year budget forecasts into perspective. According to their 2008-2017 budget made in 2007, they forecasted the total pubic debt would fall from $4.995 trillion in 2008 to $4.274 trillion in 2017. It didn’t. Instead it is forecasted to jump by $10 trillion to $14.743 trillion in 2017. Again, the CBO understated the rising public debt by $10 trillion.
Moreover, the CBO forecasted that the U.S. government would enjoy a $800 billion net surplus from 2008-2017. Instead, the net annual deficits from 2006 to 2016 accounted to over $8 trillion. So, they blew that by almost $9 trillion. We get that $9 trillion figure by adding the $800 billion surplus to the $8 trillion deficit.
If the CBO got their ten-year budget from 2008-2017 off by $10 trillion in public debt and $9 trillion in cumulative annual deficits, how much will their 2017-2026 budget forecast be off by???
Hell, the CBO forecasts $9 trillion more in public debt by 2026 and $8.5 trillion in cumulative annual deficits. So, in all likelihood, their forecast will be off by at least 50%, or more.
Again, total current U.S. debt is $19.9 trillion. This includes $14.4 trillion in public debt and $5.5 trillion in Intragovernmental Holdings. If the CBO is budgeting $23 trillion in just public debt, we can add another $6-7 trillion for Intragovernmental Holdings, for a total of $30 trillion by 2026. But, wait… they are probably going to be off by at least another $10-$15 trillion
What kind of interest on the debt would it be if U.S. total debt reached $40 trillion?
Actually, I doubt we are going to make it that long. If you have been reading my energy analysis, the WHEELS FALL OFF THE ECONOMY well before 2026. And in all likelihood, the sinking of the U.S.A TITANIC will probably take place during President-elect Trump’s administration.
Lastly…. there seems to be a many disillusioned precious metals investors who are throwing in the towel due to the supposed Trump Kool-Aid. This doesn’t surprise me one bit. It takes a special person to stick to their guns when the GOING GETS ROUGH.
While the U.S. debt will continue higher, along with the broader stock markets, trying to time the EXIT STRATEGY will be the worse mistake anyone can make.
- Source, SRS Rocco