Even though
I would imagine this must have done wonders for already disenchanted silver investor. Which is why I decided to write this article. Even though the present downturn in the paper silver price can be quite frustrating to many investors, SILVER’S REAL VALUE is totally misunderstood by the market.
To understand how the silver price is being manipulated, we have to first understand the silver pricing mechanism. To explain this, I decided to use one of the largest primary silver mining
Unfortunately, the majority of the market still believes that “Supply & Demand” are the leading drivers of price. They aren’t. While I used to believe in this economic theory, I no longer do. I have made the case for this in several of my past articles, but I will show it again using Pan American Silver as another example
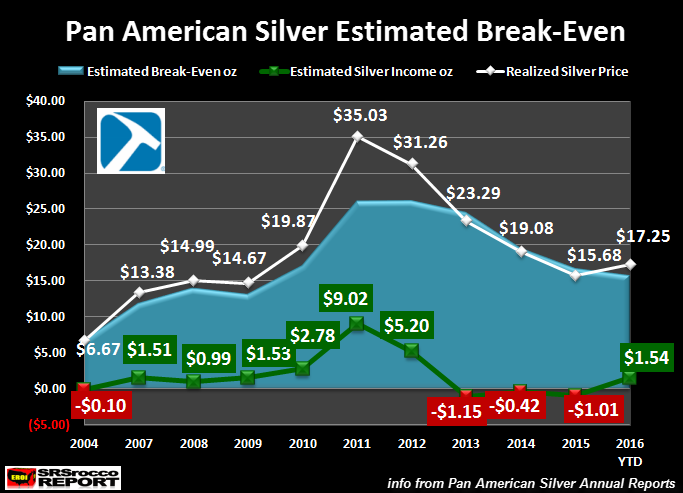
I have updated my chart below to show Pan American Silver’s “Estimated Break-even” from 2004 to 2016:

This chart may seem a bit complicated, but it’s not. The top of the BLUE AREA is Pan American Silver’s estimated break-even, the WHITE LINE represents the realized annual silver price and the GREEN or RED figures show the estimated profit or loss per ounce each year.
Basically, when the white line is above the blue area, Pan American Silver made a profit and when it fell below, they suffered a loss. So, except for a few really good years (2011 & 2012), Pan American Silver did not make much money for each ounce of silver they produced. Pan American Silver enjoyed a $9.02 profit per ounce in 2011 and $5.20 in 2012. However, they lost money in 2004, 2013, 2014 and 2015.
- Source, SRS Rocco, Read More Here


